ROCK SPRINGS, Pa. — Penn State University is coming out with something many Pennsylvania landowners with an interest in shale oil and gas development will want to examine.
Penn State Marcellus Center for Outreach and Research associate director Jim Ladlee said he has been working on developing the production curve and royalty estimations. Now, Penn State is offering a web-based app to look at data across Pennsylvania.
Online app
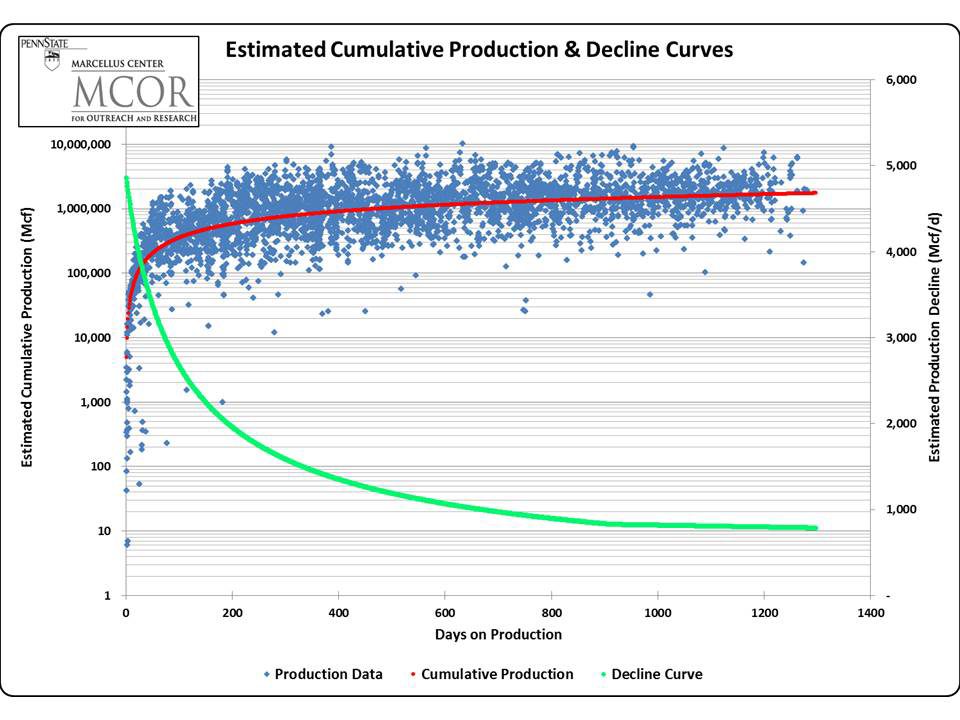
To produce the app, the team analyzed 4,000 horizontal shale wells. Ladlee said that by looking at actual well production, a cumulative production model was assembled to create royalty estimates and help landowners make better decisions.
30 year wells
Ladlee said the projections he sees in the cumulative production and decline curves show what the wells will be producing for the next 30 years.
He estimates that most wells will produce between 4 and 8 billion MMcf (MMcf is 1 million cubic feet) in the well’s lifetime, but, he added, wells in Bradford, Lycoming, Susquehanna, Washington and Greene counties are showing estimates above those marks.
He said the early stage of shale exploration included well production estimates based on experience with other shale formations like the Barnett Shale.
Challenges
Ladlee said the early estimates were useful for companies to develop an interest in further Marcellus development, but the lack of actual production data made estimating production of an Appalachian Basin well somewhat challenging.
To create better well estimates and help owners of oil and gas rights estimate potential royalties, Ladlee said it is important to look at all types of factors, including initial well production, decline rates and overall production.
Predicting production
Ladlee said initial production from a well is used to estimate the potential for future production. A basic view of initial production would suggest the higher the initial well production, the more natural gas the well will produce over its lifetime.
While the initial production rate is often a guide to future production, several factors influence the initial production rate, including geology, wellbore exposure to the formation and the number of stages completed.
Ladlee said geology determines how much natural gas might be available for extraction. The geology of the Marcellus does vary, sometimes even on the same well pad.
Wellbore
The initial production rate may also be influenced by the length of the horizontal wellbore. The more formation a company has in contact with the wellbore (longer horizontal lateral), the higher the initial production might be.
In addition, the number of wellbore stages completed is also thought to influence initial production. A stage is a length of the wellbore completed at a given time.
Ladlee said a typical 5,000-foot horizontal wellbore may include 10-35 stages ranging in length from roughly 100-500 feet each.
The influence of the number of horizontal stages on initial and overall production is still a topic of debate and research, however, many drillers are trending toward more and shorter stages.
First-year production
The initial decline or decrease in production over the first year of operation of a shale well is an important variable in estimating the potential for future production.
Ladlee said the steeper the first year decline in production, the lower future production estimates will be.
Decline
For example, if a well has an initial production rate of 10 million cubic feet per day and declines over the first year to 3 MMcf, future production estimates need to be based on 3 MMcf per day.
Ladlee said the average first-year decline rates across Pennsylvania appear to range from approximately 60 percent to 80 percent.
Ladlee explained that as shale wells remain in production, the volume of natural gas will shift from a sudden decline to a steady exponential decline.


Very good article ..however , I am not sure what is meant by “stages” in the horizontal bore , likely this is referring to the hydraulic fracturing stages? Also any idea of the % of NG recovery from each well bore ? I am told in some instances it is estimated at just above 60% , that ratio of extraction would come into play for “refrac” which will also change the PSU model of recovery, both as to volume produced and total time in production. Thanks kris vanderman
I was wondering where the app link is found? Thanks for article with outlook.
How do I download this app? Where do I find it?
Barbara Reel