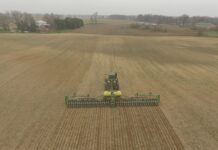
For several weeks attention has been given by grain market analysts to the fact that the harvest was dragging on, and we still do not actually know what the harvest is.
Harvest not complete
On Dec. 9, the USDA released the last Crop Progress/Crop Condition Report for the year, with the crop not completely harvested. The report showed that the American corn crop is now just 92% in the bin, and likely the balance will be left in the field.
Last year, after a late harvest, we were done at this time. The average harvest is finished by now. Not this one, and articles in major farm publications have discussed the realities of winter and spring harvest.
First, farmers may hope that the corn will dry down naturally and gain some test weight if left in the field. Farmers with 47-pound test weight and 40% moisture figure they may be throwing good money after bad to incur the drying costs for corn that is not marketable.
Left unharvested?
Others have been faced with wet weather that prevented harvest. The reality is that corn does not dry much in cold weather, and losses from lodging and mold may be high. Another reality is that this unharvested corn may never be counted right in the January reports. Are final harvested acres final if there is corn in the fields in North Dakota (57% uncut), Michigan (26%), South Dakota (17%), Wisconsin (26%), Ohio (7%), and Iowa (5%)?
Then there are other factors when we think of final crop size. It is known that lower-quality corn does not yield as much ethanol or feed value as normal corn. Will we underestimate usage in the USDA Balance Sheet? The USDA came out with the latest Supply and Demand Report Dec. 10. We would expect that there will be no change in production figures, even though everybody and his dog knows that the production numbers as shown so far are too high.
That leaves us the final January Inventory Report to be right, and it can’t be with 8% of the crop unharvested, and maybe abandoned. We are talking about a billion bushels of corn that may or may not ever materialize. And, if it does, it is of suspect condition and quality.
Corn versus soybeans
It is interesting that the corn and soybean charts do not resemble each other. The corn chart shows a gradual decline in value since the Oct. 14 March futures high at 4.113⁄4. We were trading 3.751⁄4 Dec. 10, 36 and a quarter cents off that high.
The January soybean chart, meantime, shows a major and sharp decline since that same Oct. 14. Then we were 9.591⁄2. We made a low Dec. 2 at 8.671⁄2. A sharp bounce the last five sessions has got us to 9.031⁄2. Remember, we used to think 9 was a hard bottom.
China trade effect
Blame the sharp soybean decline on the disappointing China trade news that has see-sawed the markets until traders just don’t care anymore. They are ready to rally on a confirmed trade deal, but little else. Recently this has seemed likely, hence the gains.
The threatened day of increased U.S. tariffs is Dec. 15, which is at hand. China has recently waived tariffs on our soybeans, as they need them, and more. This comes even as its hog population is rumored to be reduced by half because of Asian swine fever.
Suffice it to say that I remain bullish, as I look forward to eventual trade agreement with China, and to a January report that is closer to reality as far as reporting grain bushels that were actually harvested instead of assumed by some computer analysis.


