It is not much fun trying to get a handle on grain markets these days. Once it seemed simple: Watch the charts to see if we could break resistance, then bet on higher prices.
Trouble is, we broke through resistance on the corn charts, traded sharply higher for three days, then traded both sides of the line for five days. Of the five, we only closed above the line one day. Now we are trading several cents below the line this Tuesday morning (June 20), and bullishness seems to have faded into improving USDA Crop Condition Reports.
Since early April, the magic number in the old corn crop has been plain to see. We traded to just at or above 3.79 July futures three times. A fourth we came close, at 3.77 1/2. Thus, it was easy to say that the market was defining a “line of resistance” just above 3.79. That is, we could expect to trade below that line in absence of news to break us out of the range we were bound in.
That breakout seemed to come as all the acres of corn did not get planted. We were delayed by rain, then a brief spell of good weather was too brief to finish up in time.
Crop condition
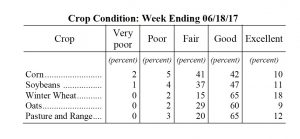
Adding to the uptrend was the USDA Crop Condition Report that showed that the total of good and excellent ratings for the crop was several percentage points below normal.
The crop condition was no surprise to anyone in northeast Ohio, where only corn on the lightest soils showed much growth in May. Two and three years ago when we were seeing huge crops, we had warm and dry weather in May, and the good corn was knee high by the fourth of June, not the fourth of July.
Monday afternoon, Uncle Sugar reported Ohio at just 52 percent good and excellent. The U.S. is at 67 percent good and excellent, but last year we were at 75 percent.
Some of this decline is due to the late development of the crop. Some is because of weather conditions. We need to see improvement fast, and we did see general rains in the Eastern Corn Belt that relieved a little of the dryness that has plagued us recently.
The breakout for July corn futures came quickly, in two days, to 3.91 3/4 on June 8. Happy days were here again (except for the crop growth)!
Happy days did not last long. After three days above the magic 3.79 1/4, July corn futures dropped to 3.76 1/4 on June 10, down over a dime for the day. Three sessions later, we were down to 3.70 at one point, although we did close at 3.79 1/2, just above that mythical line again. That close was encouraging, and we were higher for one day, but we closed at 3.74 1/2 Monday. December futures show a similar pattern, just with higher price levels.
In fact, the most notable feature of the charts these days is not the struggle with staying about the resistance, but is the spread between old crop and new crop prices.
The difference between July of 2017 and July of 2018 is now 37 1/2 cents this Tuesday morning. This is the difference between surviving the record crop of 2017 and anticipating the reduced circumstances of 2018.
For December corn futures, we have a line of resistance just above 3.95. Our high was 4.09 on June 8. This morning we are 3.92 1/2.
What about beans
The end of May the talk was all about how corn acres could shift to beans. The worry was that corn prices could go up, but the soybeans would go down. In fact, the beans have turned away from the low the last day of May at 9.15 1/2 November futures, and rallied right into yesterday, with a high of 9.58 1/4 on Monday.
It would seem that the market is more worried about crop condition than about acres. This morning, however, we are off a nickel, at 9.43 1/2.
Wheat prices are dominated by dry weather in North Dakota, which is seeing the spring crop not get established and the winter crop being abandoned. DTN had a feature article on this early Tuesday.


