A clear advantage of Ohio’s dairy industry is that one herd size or management system does not fit all. Even while the U.S. dairy industry continues a long-term trend of consolidation, there continue to be successful farms of many sizes.
How long will that trend continue? That is unclear, but the bottom line is, excellent animal husbandry, crop and feed management and business management (which includes labor management), the success trifecta, are critical to getting into and staying in the top third of farms.
Those are the farms that have the most fun milking cows and the most staying power, because they consistently make enough money to weather market lows, reinvest in and improve their farm businesses.
When dairy farms enroll in the Ohio Farm Business Analysis program, we do enterprise analysis for the dairy, and their crop enterprises.
But before we venture into the enterprise analysis, a whole farm analysis is completed and generates an accrual adjusted income statement, cash flow statement, statement of net worth and the 21 Financial Standards Measures that are used across agriculture as benchmarks of farm financial performance.
Let’s put those two sets of information together today for two sets of farms that completed their 2019 analysis.
Finances and production
In Table 1, we are looking at selected production and financial measures for 12 farms sorted into two groups; herds with 100 to 200 cows, and herds with greater than 500 cows. We need to acknowledge two things; these are farms that chose to do analysis, not a random selection, and it is a small sample size.
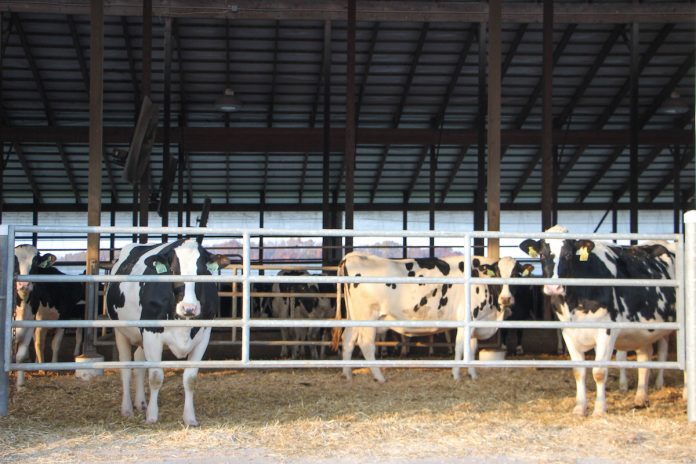
The 100 to 200 cow group has an average herd size of 141 cows with herds ranging from 108 to 172 cows. The 500+ cow herds averaged 774 head per herd ranging from 595 to 1,200 cows.
Net return per cow for each of these groups was higher than the $249 per cow average for all 17 conventional herds. Milk production was about 2,400 pounds higher for the 500+ cow herds.
With an average milk price 48 cents per hundredweight lower than the 100 to 200 cow herds, they still generated a higher total milk income per cow. However, the 100 to 200 cow herds were able to retain more of the revenue per cow, with a net return per cow of $611 compared to $287 per cow for the larger herd size group.
Labor
Labor measures for the two groups are shown in Table 2. The 500+ cow herds shipped more milk per person as well as per cow using approximately five less labor hours per cow. Hired labor was a larger expense for the 500+ cow group, averaging $2.52 per hundredweight and $657 per head.
Income
The median net farm income is shown in Table 3. This is an accrual net farm income which differs from net return per cow as it will include income from crop sales and other farm income as well as milk income. The 500+ herd size group generated a higher rate of return on assets, although both groups were below the competitive benchmark.
This and the lower current ratios are not surprising given the long-term low milk prices experienced by Ohio dairy farmers. Farm total Debt to Asset ratios were higher than the competitive benchmark for both groups. Both groups showed a normal range in net return per cow.
Simply taking herd size times net return per cow gives us an indication of the dollars generated by the dairy enterprise to cover family living, make principal payments, pay income tax liabilities, build cash reserves and reinvest in the farm business.
Top farms
The top third farms generated approximately $170,000 (100-200 cows) and $500,000 (500+ cows) to meet these needs. The middle third generated approximately $77,000 (100-200 cows) and $224,000 (500+ cows). The bottom third did not have fun, generating slightly more than $10,000 (100-200 cows) and negative returns for the 500+ cow group.
The farms in the top third have found the combination of animal husbandry, crop and feed and business management that works for their farms. They will have to keep working on those three areas to stay there.
The middle and bottom third are investing time in analysis to know where they are compared to the top third, identify opportunities for improvement, and push their farms into top-third territory.
Program. There is still time to enroll in the 2020 Ohio Farm Business Analysis Program. Farms can enroll now and work with their technician to complete their analysis by the May 27 deadline.
The information you receive from your analysis will tell you where you were in 2020. Using the results including personalized benchmark reports to inform your farm’s animal husbandry, crop and feed management and business management decision-making is a step on the road to the top third.


