Tag: infographic
2015 is the International Year of Soils (Infographic)
2015 is the 60th anniversary of the National Association of Conservation Districts' Soil and Water Stewardship Week.
April is soyfoods month (Infographic)
Research supports the health benefits of soyfoods, such as lowering cholesterol, stabilizing blood sugar levels and providing vitamins and minerals.
Ohio’s producing wells as of March 2015 (Infographic)
Ohio's producing wells and shale drillers as of March 28, 2015.
Ohio’s maple syrup (Infographic)
Ohio is the 6th largest producer of maple syrup in the United States.
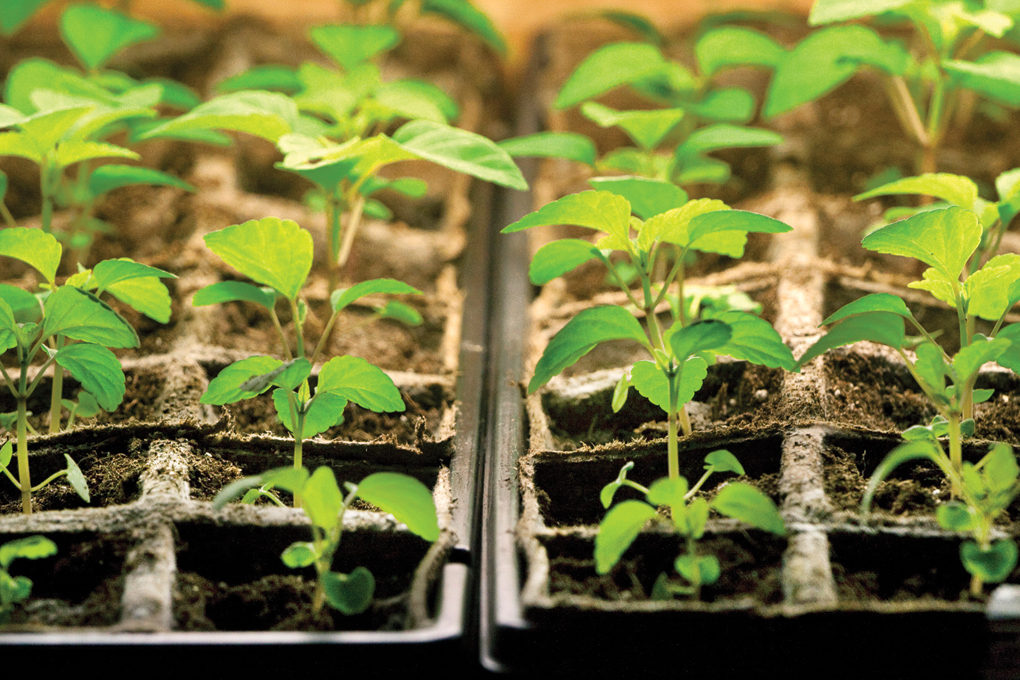
Winter growing: Starting seeds indoors (Infographic)
Winter is the perfect time to start your spring garden.
Your health starts here: Reading nutrition labels (Infographic)
A lot of information is packed into a nutrition label, from serving size to percent daily value (% DV).
100 years of Farm and Dairy (Infographic)
We're wrapping up our 100th anniversary year with this special infographic.
Renting farm facilities: Average cost in the Midwest (Infographic)
Read more: Vacant farm buildings can hold value
Infographic: Ohio’s top producing wells as of Sept. 2014
Ohio's top producing shale wells as of Sept. 2014.


